Quick Answer
Different neighbourhood signals require different search radii—school catchments, transit access, flood risk, amenities, crime, and demographic change each have their own map boundaries. In BC, public data helps buyers and agents interpret these signals, but knowing which radius fits which signal is key to reading the area honestly.
Why Signal Boundaries Matter When Scanning a Neighbourhood
Each type of neighbourhood feature—whether it’s education, transit, hazard, or lifestyle—has a zone where it truly matters. For example, school catchments have fixed boundaries, while park access might be about the closest few blocks. Reading public data around a Vancouver building means first knowing which feature you’re measuring, and how far its influence realistically stretches.
Getting this wrong can mislead decision-making. A crime statistic drawn too widely may not reflect the local street. A grocery store two kilometres away is different from one across the corner. For strata buyers, understanding these boundaries is as central as reviewing a Form B or depreciation report.
How BC Public Data Maps Vary by Feature
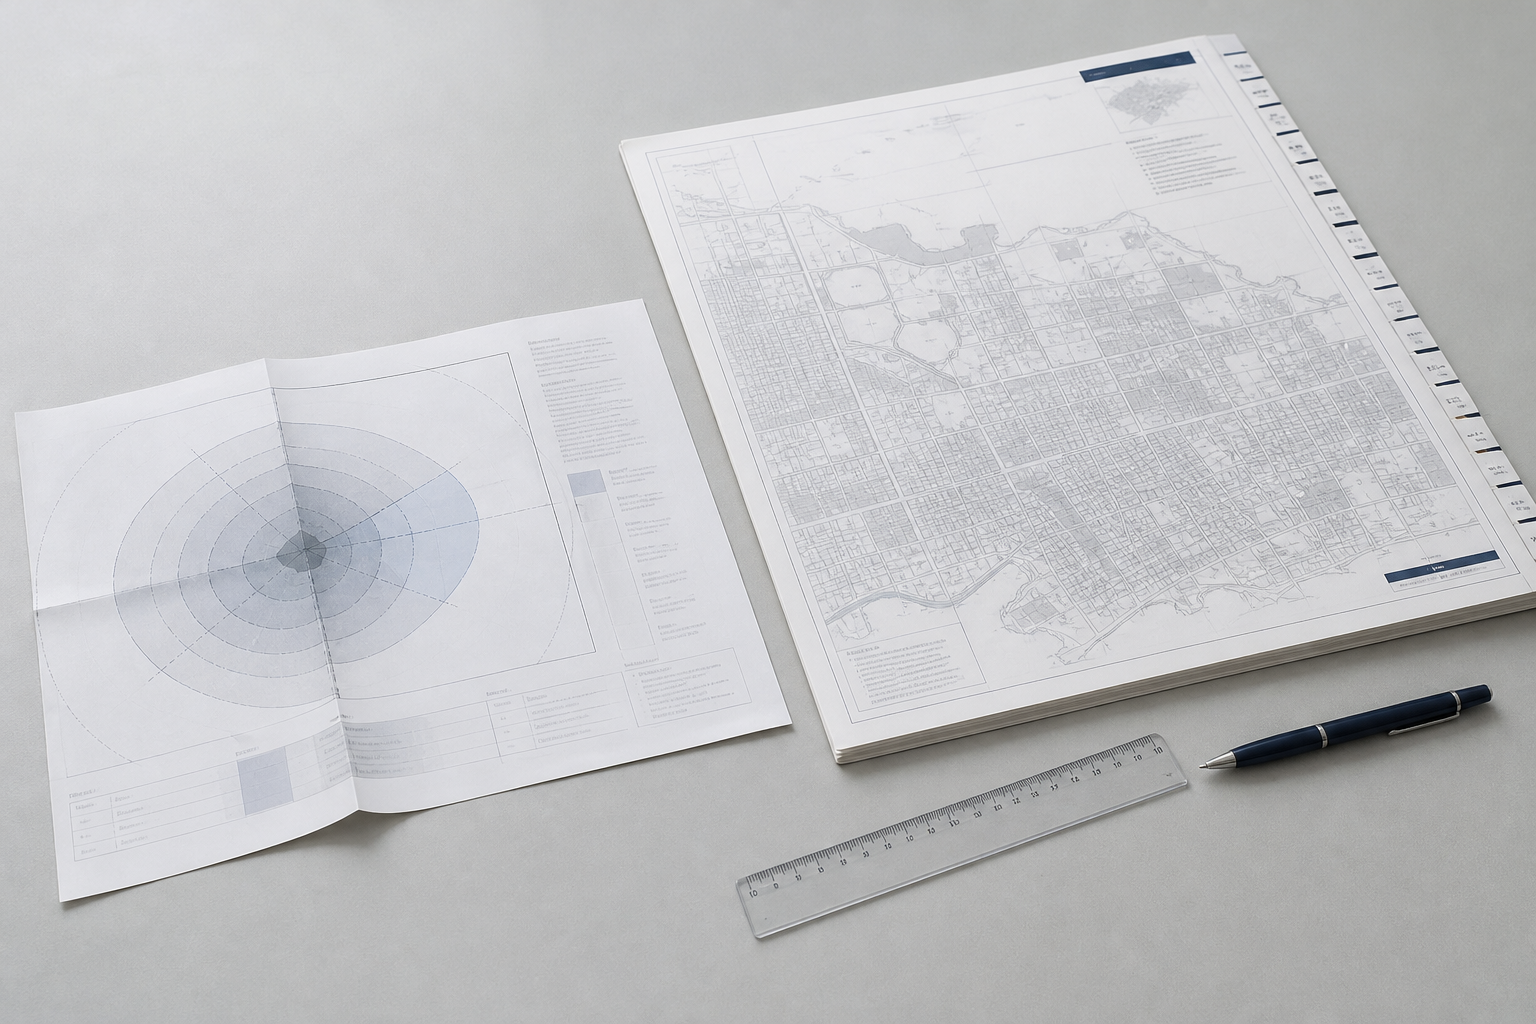
BC’s open data portals and city planning tools supply interactive maps for schools, transit, hazards, and more, but each dataset is mapped differently.
- School catchments: Sharp, legal boundaries—find the exact catchment map from the local school district.
- Transit access: Measured in walking time or straight-line distance from stops or stations—handy for Burnaby or Surrey buyers eyeing SkyTrain proximity.
- Hazard zones: Floodplains, wildfire interfaces, and seismic risk are mapped region-wide with overlays. Always check official hazard maps.
- Amenities and shopping: “Walk score” tools use a radius—often up to 800m, but relevance varies depending on urban/rural context.
- Crime data: Usually mapped by neighbourhood or police beat, which may cover a much broader area than the street around a given building.
Which Signals Are Local—And Which Move With the Map?
Some features are pin-drop local, like school catchments—which can change block by block. Others, like transit or walkable shopping, matter most within a short radius (often 5–10 minutes on foot). Crime and demographic stats, however, are typically reported for much larger areas and can mask local variation.
For a building in Richmond, a flood zone might cover the whole neighbourhood, while a single rezoning could change the feel of just one corner. Understanding which data type responds to moving the map—and which doesn’t—helps buyers weigh what truly shapes daily life.
Where Data Changes Fast: Development and Demographics
Development activity (such as new rezonings, approved towers, or added amenities) can shift an area’s character within a few years. Municipal open-data portals often track active and pending development permits, but the impact zone depends on the project type. A major rezoning on the block may be more relevant than a distant new park.
Demographic change—age, language, or household size—tends to move at the scale of census tracts, often larger than a buyer’s search radius. For current detail, public dashboards and city stats are a start, but walking the neighbourhood and speaking with local residents adds needed context.
Reading Hazards and Infrastructure: Don’t Rely on an Address Alone
Hazard mapping in BC is highly geographic: a building in Victoria might sit on the edge of a floodplain, while a block away is unaffected. Always check local government or provincial maps for flood, seismic, and wildfire risk, and verify the latest data before drawing conclusions.
Major infrastructure (sewers, power, water) is less likely to be revealed by a quick public search, but nearby construction or planned upgrades can affect noise, accessibility, and even insurance costs. For buyers, layers like these belong alongside How to Read BC Neighbourhood Change: Interpreting Public Data on Schools, Transit, Hazards, and Amenities in a review toolkit.
Frequently Asked Questions
How can I check which school catchment a BC strata is in?
The school district’s official catchment map or address lookup tool shows which elementary or secondary school a property is zoned for. Always verify directly with the school district or its website.
Where do I find up-to-date crime data for a neighbourhood?
Many BC police departments publish recent crime data by neighbourhood or police beat. Since boundaries and reporting frequencies vary, check the police agency’s website for the most current and relevant statistics.
What is the best way to check flood or seismic risk in BC?
Flood, seismic, and wildfire risk maps are available from provincial and municipal sources. Use official government maps or consult a qualified professional for building-specific risk.
How do development applications affect neighbourhood change?
Development proposals and rezonings may change the character of a block or area. Municipal websites often provide interactive maps or lists of current and recent proposals in each neighbourhood.
Do walk scores and amenity ratings mean the same thing in every city?
Walk scores and amenity ratings depend on local context—what counts as walkable in an urban core differs from what’s convenient in a suburban or rural area. Always check the underlying map for details.
Conclusion
Every neighbourhood signal—transit, schools, hazards, amenities, crime, demographics—changes at its own map scale, and reading them correctly is essential for BC buyers and their agents. Relying on the right public data (and knowing where its boundaries start and stop) leads to better-informed decisions. Document review is just one piece—tools like SearchStrata can help you look deeper at the building, but understanding the area around it is just as important. For more on interpreting these public data signals, see the BC city guides and related posts above.