Quick Answer
Reading a BC strata neighbourhood means pulling together public data on transit, schools, hazards, crime, amenities, infrastructure, and local change—without editorializing what’s “good” or “bad.” Each dataset has its own context, limits, and search radius. By learning where to find and how to interpret these signals, home buyers and their agents can make informed decisions about what truly surrounds a building.
What can public data tell you about a BC strata neighbourhood?
Public data reveals key signals about a neighbourhood—transit options, school catchments, flood or seismic hazard, local amenities, active development, and shifting demographics. Each data source comes with its own strengths and blind spots, requiring thoughtful interpretation. For example, a school catchment map may define boundaries that don’t align with a simple walk radius, and crime data aggregates statistics over different periods and geographies. Rather than drawing simple conclusions, a careful review of these signals provides a realistic foundation for a buyer’s due diligence.
Transit maps show both current and planned routes in regions like Vancouver, Burnaby, and Surrey, while development application databases reveal upcoming zoning changes or major projects. Amenity locations—parks, libraries, community centres—are available through city open data portals. Each of these layers helps create a fuller picture of daily life around the building.
How do you interpret transit access and planned expansion?
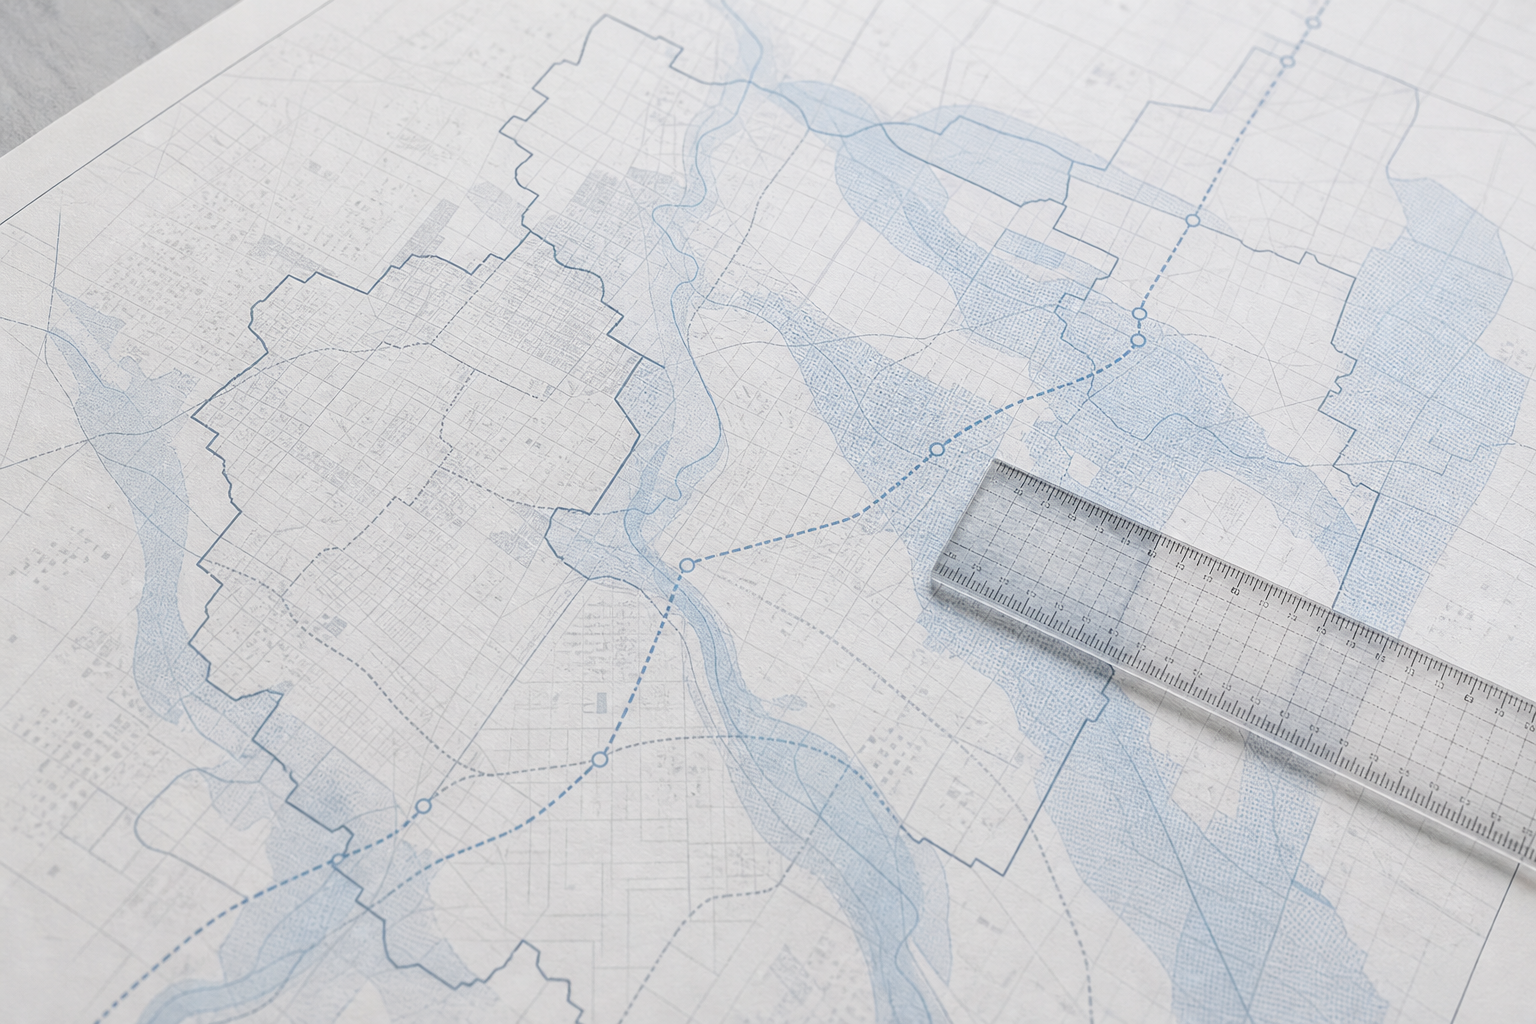
Transit is one of the most dynamic signals in Metro Vancouver and the Fraser Valley, with expansions shaping neighbourhood accessibility. The TransLink website and municipal open data portals publish current bus, SkyTrain, and SeaBus routes, and often highlight planned expansions and rapid transit proposals. These plans affect commute times, future property demand, and even the character of local streets.
For buildings in Victoria or the Okanagan, regional transit agencies provide maps and schedules online. When reviewing a location, check the proximity to rapid transit or frequent bus corridors, but also scan for planned transit stations or service increases that may impact the area in the next few years. Remember, a planned project can be delayed or changed; always verify the current status on official transit sites.
How do school catchments and hazard zones shape neighbourhood boundaries?
School catchments and hazard maps often set boundaries that don’t match a generic walkable radius. In BC, public school boards publish interactive maps showing which addresses fall into each elementary and secondary catchment—these can shift with enrolment or board decisions, so always check the latest map for the specific address under consideration.
Floodplain, seismic, and wildfire-interface maps are published by provincial agencies and many city planning departments. For example, parts of Richmond and New Westminster may sit in mapped flood hazard zones, while some Okanagan communities have wildfire-interface overlays. These maps are updated periodically and can affect insurance costs or future planning. Never treat hazard maps or historical flood data as current without consulting the latest version from the provincial or local government.
How should buyers read crime data and amenity access?
Crime data is available by neighbourhood or policing district, but interpreting it fairly takes care. Police and city open data portals publish periodic reports, often mapping incidents by type and frequency. Because reporting practices, neighbourhood boundaries, and statistical periods differ, it’s best to compare general patterns, not raw numbers or rankings. Crime data can change year to year or even block to block, so always check the official source for the period and area you want to analyze.
Amenities such as parks, grocery stores, health clinics, and recreation centres are mapped by municipalities. Unlike catchments or hazard areas (which can be sharply bounded), amenity access often depends on walkability, public transit, or road networks. For example, a building might border a large park but still be a 15-minute walk from the nearest supermarket.
Where can you find data on local infrastructure, development, and demographic change?
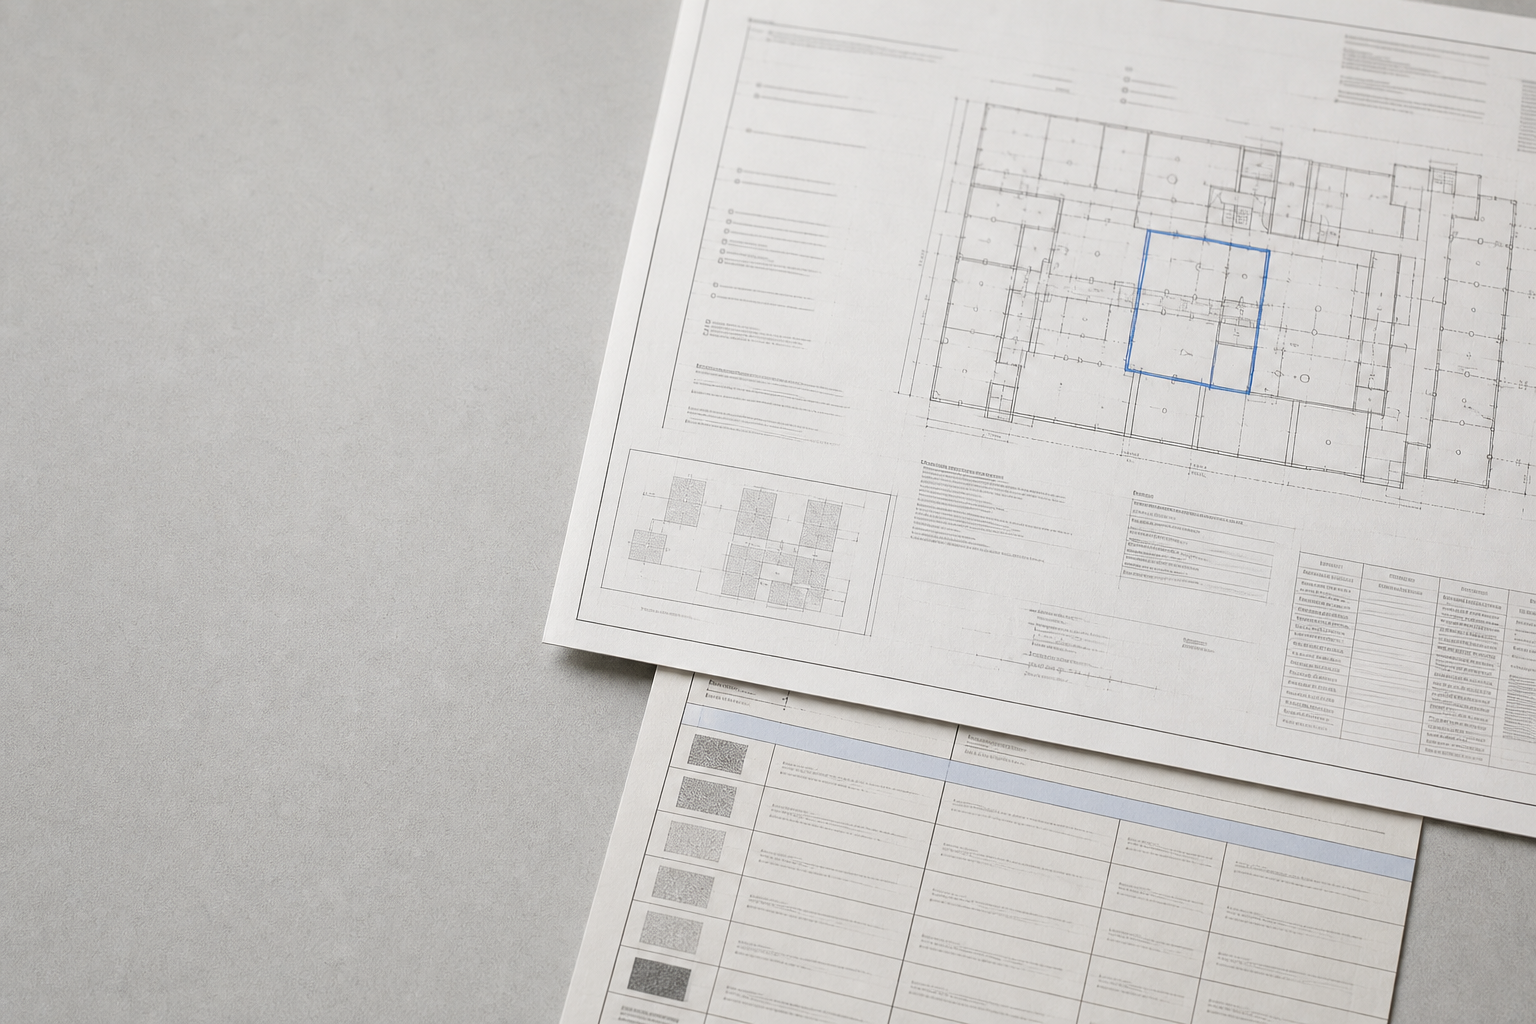
Most BC cities maintain online, map-based registries for active development permits, rezonings, and public infrastructure projects. These databases show what’s coming—new towers, roadworks, or planned water and utility upgrades—that can reshape traffic, views, and neighbourhood dynamics. Checking these maps gives buyers insight into potential future construction or shifts in local land use.
Census data and municipal planning reports can provide a high-level sense of demographic change—such as age distribution, home ownership rates, and languages spoken. For more in-depth signals and how to interpret shifting neighbourhood patterns, see How to Read Neighbourhood Change from Public Data in BC.
What search radius should you use for each data type?
Each neighbourhood signal has its own meaningful search radius. For example:
- School catchments are fixed areas set by the school board—addresses just meters apart may fall into different catchments.
- Transit access is often measured in minutes (5- or 10-minute walk) to key stops or stations, not just as the crow flies.
- Hazard zones follow mapped boundaries that can cross streets or split building lots.
- Amenity access depends on walkable routes, not straight-line distance, and what’s important varies by buyer.
There’s no single right answer—review each dataset’s scope and update frequency, and always supplement public maps with on-the-ground walks or visits when you can. For a broader strategy on combining these signals, see Reading Transit, Schools, Hazards, and Change: How to Evaluate the Area Around a BC Strata.
Frequently Asked Questions
Where can I find up-to-date flood or wildfire hazard maps for BC neighbourhoods?
Many BC cities and the provincial government publish interactive hazard maps on their official websites. Always check the most current map for your area of interest.
How do I know if a school catchment has changed for a strata building I’m considering?
School boards update catchment maps as needed. Visit your local school district's website and enter the address to confirm the current catchment assignment before making decisions.
Where can I find crime statistics for a neighbourhood in Vancouver or Surrey?
Police departments and city open data portals publish neighbourhood crime statistics, often in map or annual report formats. Ensure you are reviewing the latest available data for your area.
How do I see if a major development or rezoning is planned near a BC strata?
Municipal websites provide searchable maps of active and approved development applications, rezonings, and infrastructure projects. These are updated regularly to reflect changes.
Can I use SearchStrata to analyze what’s around a building?
SearchStrata focuses on strata documents, but understanding the neighbourhood context is equally important for buyers. Combining both types of data gives a more complete picture.
Conclusion
Knowing how to read the signals around a BC strata building empowers buyers to make more informed decisions—without letting opinions or outdated data steer the process. Always check the latest public sources for transit, schools, hazards, amenities, and planned change, and consider how the scope of each dataset fits your needs. To take the next step with detailed strata document review, you can also look up any BC strata building free with SearchStrata.