Quick Answer
Reading what surrounds a BC building means translating raw neighbourhood data—like transit, school catchments, hazards, crime and amenities—into real signals that affect daily life. Public sources provide these layers for Metro Vancouver, the Fraser Valley, Vancouver Island, and the Okanagan, but each data type covers a different radius and refresh rate. Understanding these differences helps buyers see beyond the building and make sense of how the area is changing.
How Can Transit Data Shape Your Experience?
Transit data shows how easily you can move around the city, but the most useful signals depend on planned expansions as much as current service. BC Transit and TransLink publish route maps and future projects, but new SkyTrain lines and bus exchanges, like those recently announced in Surrey and Burnaby, may not translate into service for several years. When using these sources, compare walk distances to actual stops—what looks close on a map may involve a steep hill or major arterial. For buyers relying on transit, check both current trip planners and official future-project maps. Even if a station is planned, verify its construction status and whether the service will match your commute needs.
How Do School Catchments and Their Shifts Affect Buyers?
School catchment boundaries define where local children can attend public school, but these zones can shift as enrolment and development patterns change. In Vancouver and Surrey, boundary adjustments often follow new school openings or closures, major rezoning, or demographic swings. Buyers should check the official school district website for current maps and any proposed changes. Don't rely on marketing materials or third-party websites for catchment data—confirm directly with the district. For families, watch for public consultations on boundary revisions, which can signal future catchment shifts. Remember, walking distance and catchment are separate: a nearby school may not be your assigned one.
What Public Hazard Data Tells You (and What It Leaves Out)
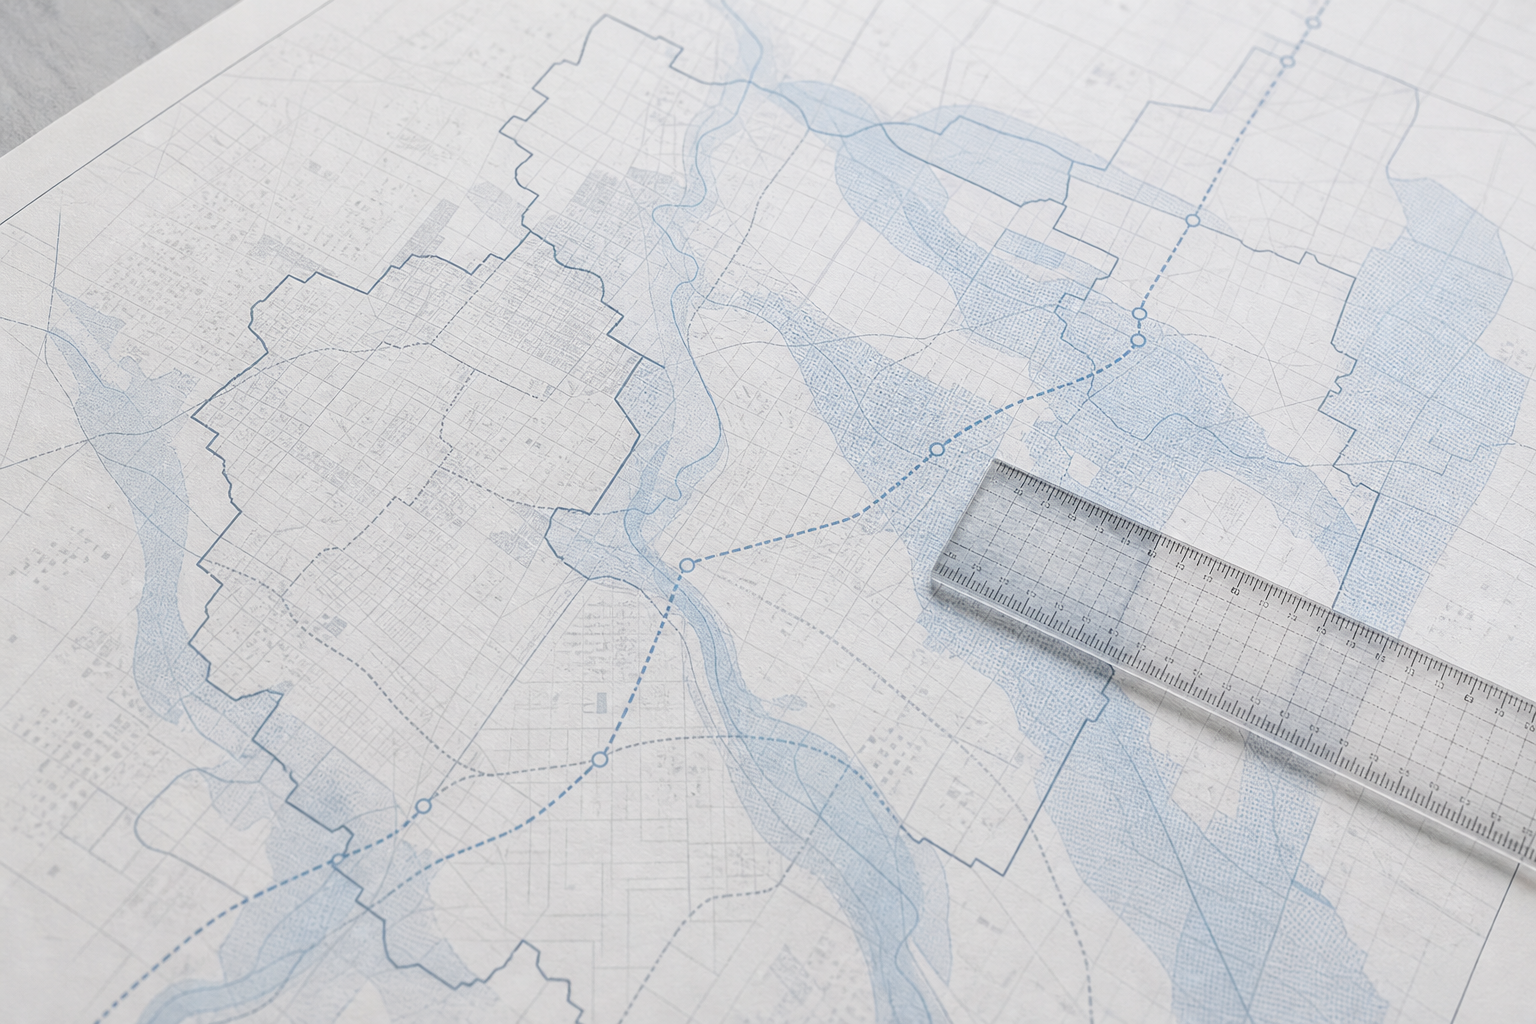
Floodplain, seismic, and wildfire-interface maps show hazard exposure at both building and neighbourhood scales, but interpreting them demands care. Official floodplain maps are available through municipal and provincial portals, such as the BC government’s flood hazard data and local city websites for places like Richmond and Victoria. Seismic hazard is mapped for much of Metro Vancouver and the Okanagan. Wildfire interface zones, especially on Vancouver Island and in Kelowna, are defined by both terrain and recent fire history. These maps update over time, so always check the latest version and read disclaimers. A hazard zone doesn’t mean a building is at risk—flood or fire mitigation measures, like dikes or fire breaks, also matter. Verify any site-specific risk with a qualified expert before deciding.
How to Interpret Crime Data Without Jumping to Conclusions
Crime maps are published by municipal police departments and the BC government, but figures are easy to misread. Most official systems, like the Vancouver Police Department’s public crime map, show incidents by type and time range, often at the block level. Spotting a cluster may simply reflect a busy area or more active policing—not necessarily a "bad" neighbourhood. Crime stats can also lag behind real neighbourhood change, especially in rapidly evolving areas like parts of Coquitlam. For context, look at trends over several years, types of incidents, and population density. To get the most current figures, always check the official publisher’s website. Don’t rely on word of mouth or real estate ads for crime data—interpret the numbers cautiously and use them alongside other signals.
How Do Amenities, Infrastructure, and Development Shape Daily Life?
Amenities—parks, groceries, clinics, libraries—add to daily convenience, but walkability is different from catchments or hazard zones. Tools like municipal Open Data portals and Google Maps can help you spot clusters, but be sure to check for recent closures or planned facilities. Infrastructure, such as new community centres or planned major roads, is visible through city planning applications or engineering department updates. Development applications and rezonings signal that a neighbourhood could change significantly in the coming years. Search for local development maps or city council meeting records for projects near your target building. For example, major rezonings in New Westminster have shifted school capacity and transit patterns. The right search area for these signals depends on their nature: a new grocery store affects one block; a major condo tower, several.
How Demographic Change and Population Shifts Appear in the Data
Demographic data describes who lives in a neighbourhood, including age mix, household size, and language. Census geographies don’t match school catchments or hazard zones, so use them to understand broad trends. Rapid population growth in parts of Surrey, for instance, often leads to new schools and expanded bus service within a few years, while older areas of Victoria may see stable or declining school enrolment. StatsCan releases neighbourhood-level data every five years. Watch for signs like new housing starts, rezoning applications, or infrastructure planning that suggest demographic change is underway. Use public data, not assumptions, to read these shifts—if a building’s surroundings are changing, the data will show it first.
Frequently Asked Questions
Where can I find current school catchment maps in BC?
Current school catchment maps are published on the official websites of local BC school districts. Always verify boundaries there, as third-party sources may be outdated.
How do I check if a building is in a flood or wildfire hazard zone?
Flood and wildfire hazard maps are usually available on municipal and BC government websites. Compare the building's address to these maps and confirm with local authorities for the latest updates.
Are crime map numbers in BC always up to date?
Crime maps are maintained by police departments and may lag reality or reflect reporting patterns. Always check the map's publication date and use official sources for the latest figures.
How do I know if a transit expansion will affect my building soon?
Transit expansions are listed in planning documents from BC Transit or TransLink, with construction timelines published on their websites. Check both current service maps and official project updates.
Do amenities like grocery stores and clinics appear in neighbourhood data?
Yes, many municipal Open Data portals and map services show the location of amenities such as grocery stores, clinics, and libraries, but check for recent openings or closures to ensure accuracy.
Conclusion
Neighbourhood signals come from many sources, each with its own strengths and limits. Seeing the full picture means combining transit maps, hazard zones, school boundaries, crime and amenity data, and tracking how these change over time. No single source is perfect, but public data—when read in context—helps buyers understand what daily life around a building might look like. For the building-level details, SearchStrata reviews strata documents to surface issues before you buy, so you can focus your attention where it matters most.